PREDICTIVE MODELS
Interpretation Method
During the first phase of the project, we quickly realized that the subscription model is a supervised machine learning problem. Moreover, it is a binary classification problem where we are going to build a classifier to differentiate potential subscribers and non-subscribers. In the machine learning literature, there are many viable techniques such as logistic regression, decision trees, support vector machines and random forest to choose from.
For the project, we decided to use random forest because the data includes many categorical data and, moreover, the underlying concept of decision tree is intuitive to explain to the client. We were also interested in using random forest’s feature importance statistics to perform variable selection. Our machine learning classifier is implemented with scikit-learn.
We used the following for predictor variables.
- Static features, which we use modes:
- geo_country, geo_region, geo_city, geo_zip;
- Derived.OS_Name, Derived.OS_Version, Derived.BrowerInUse_BrowserName, Derived.BrowserInUse_Version, Derived.DeviceIdentification
- Non-static features, which we use modes:
- daily_visitor_mode, post_channel_mode, post_cookies_mode, post_search_engine_mode, ref_domain_mode, domain_mode
- Non-static features, which we use maxima:
- visit_num_max, visit_page_num_max
- Non-static features, which we use distributions:
- post_channel distribution
Interpretation Result
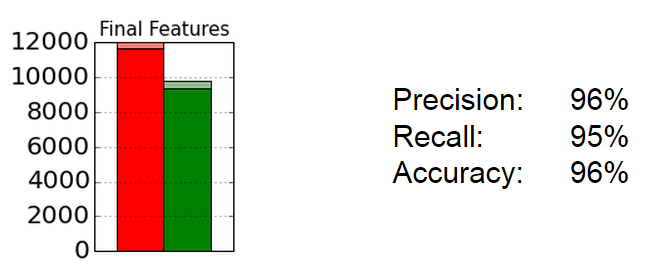
In our final random forest classifier, we trained the classifier with the above 18 predicator variables. Performing a cross-validation using 60% of the training data and validating on 40% of the training data, the classifier was able to achieve an overall accuracy of 96%. We also see that both precision and recall are also in the 95-96% range. The classifier shows that the predictors we chose and feature engineered had significant predictive power.
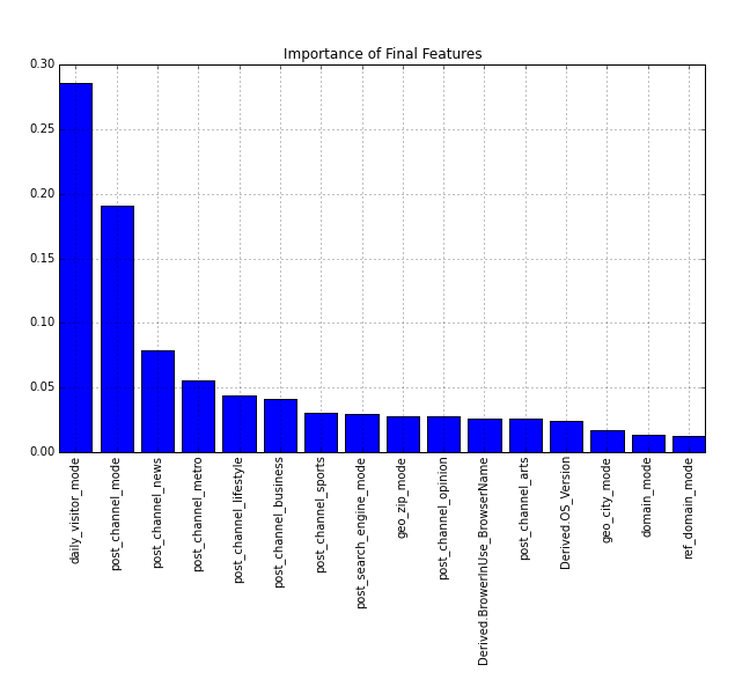
In addition, we also looked at the importance of our features in the random forest. The bar chart below shows that the most predictive covariate is the mode of a user’s daily visitor flag, followed by a few different content related covariates. Interestingly, geographic variables also show up with geo_zip and geo_city. Lastly, the type of browser is also predicative.
Prediction Method
Next, we explored a new test set to validate our classifier. The idea is to simulate the practical situation of prediction. We trained our data on pre-2015 data and tested on 2015 data to see how many subscribers can we accurately predict to sign up. First, we defined a window of 7 days before the target date, January 1, 2015. During this window, we identified subscribers who were active during this period and also did not subscribe as of January 1, 2015. With these criteria, we find that there are approximately 1,800 future subscribers and 800 non-subscribers. We then take all of their observations out of the training data and retrained the classifier. Lastly, we ran the trained classifier and tested on the 2,600 potential subscribers.
Prediction Result
The result of the simulated prediction is shown below.
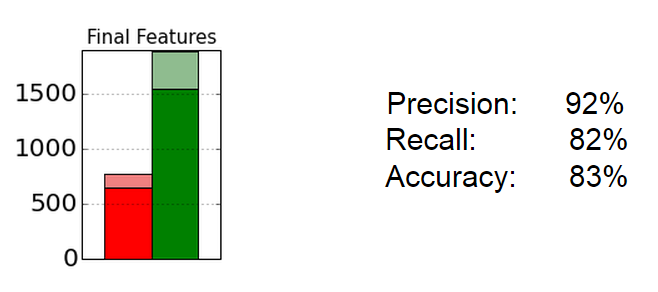
With this classifier, our accuracy and recall decreased to 80% range. However, our precision stayed relatively high. We also show the confusion matrix below for a detailed breakdown of classification.
| Predicted Non-subscriber | Predicted Subscriber | |
|---|---|---|
| Non-subscriber | 645 | 125 |
| Subscriber | 338 | 1550 |
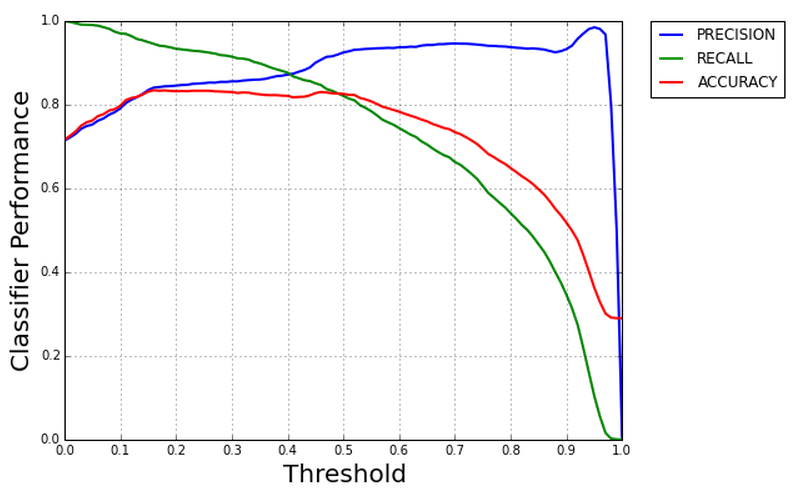
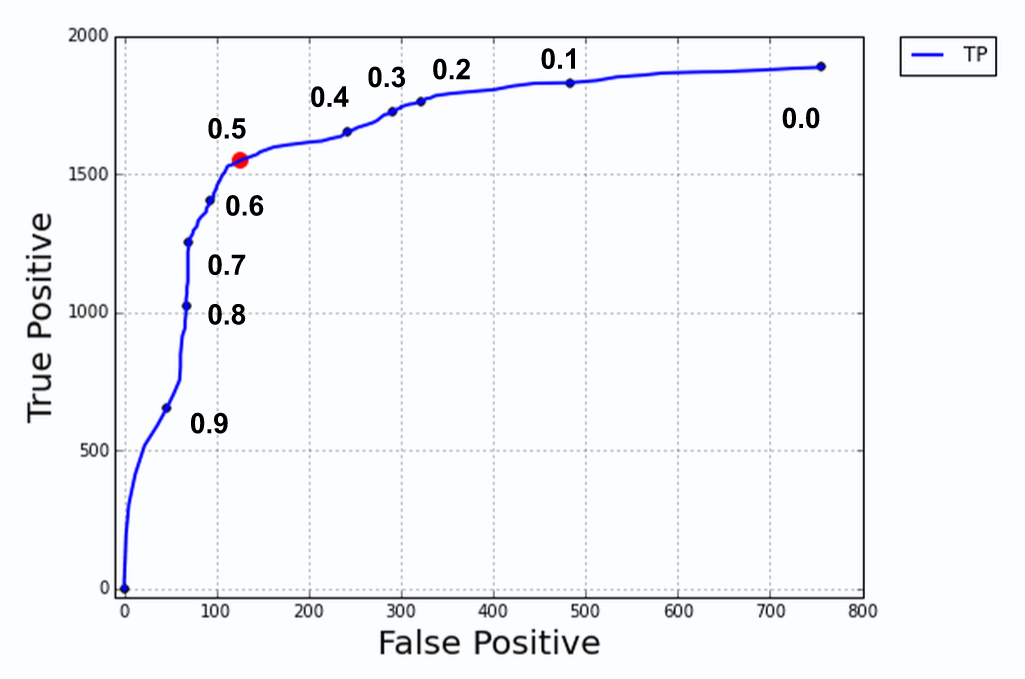
Lastly, we looked at the trade-off between precision and recall when we adjust the classifier’s threshold to classify subscribers. The default threshold is at 0.5 where if the probability is greater or equal to 0.5, the classifier would classify the observation as a subscriber. As we can see from the plot, as we increase the threshold, there is a sharp decrease in recall and small gain in precision.
Lastly, we can calculate the improvement in subscriber detection rate. Before the implementation of this classifier, the naive rate can be calculated as 25,000 divided 80 million (unique visitors). This is around 1/3,200. This means that out of every 3,200 people who visit the site, 1 of them becomes a subscriber.
With our statistical classifier which has a precision of 92% which means that on average, every 100 users that we predict to subscribe, 8 of them will be false positives and will not subscribe. If we assume that our false positive rate scaled up to the 80 million visitors. This will mean that our classifier will produce 6.4 million false positive. Since we have a recall percentage of 82%, we can identify 20,500 of the true subscribers. This means that our subscriber detection can be calculated as 20,500 divided by 6.4 million, which is 1/300. This means that on average, every 300 people we identify, 1 of them will subscribe. This is juxtaposed to the current system where we know that 1/3200 people subscribe. In conclusion, we improved the subscriber detection rate from 1/3200 to 1/300.